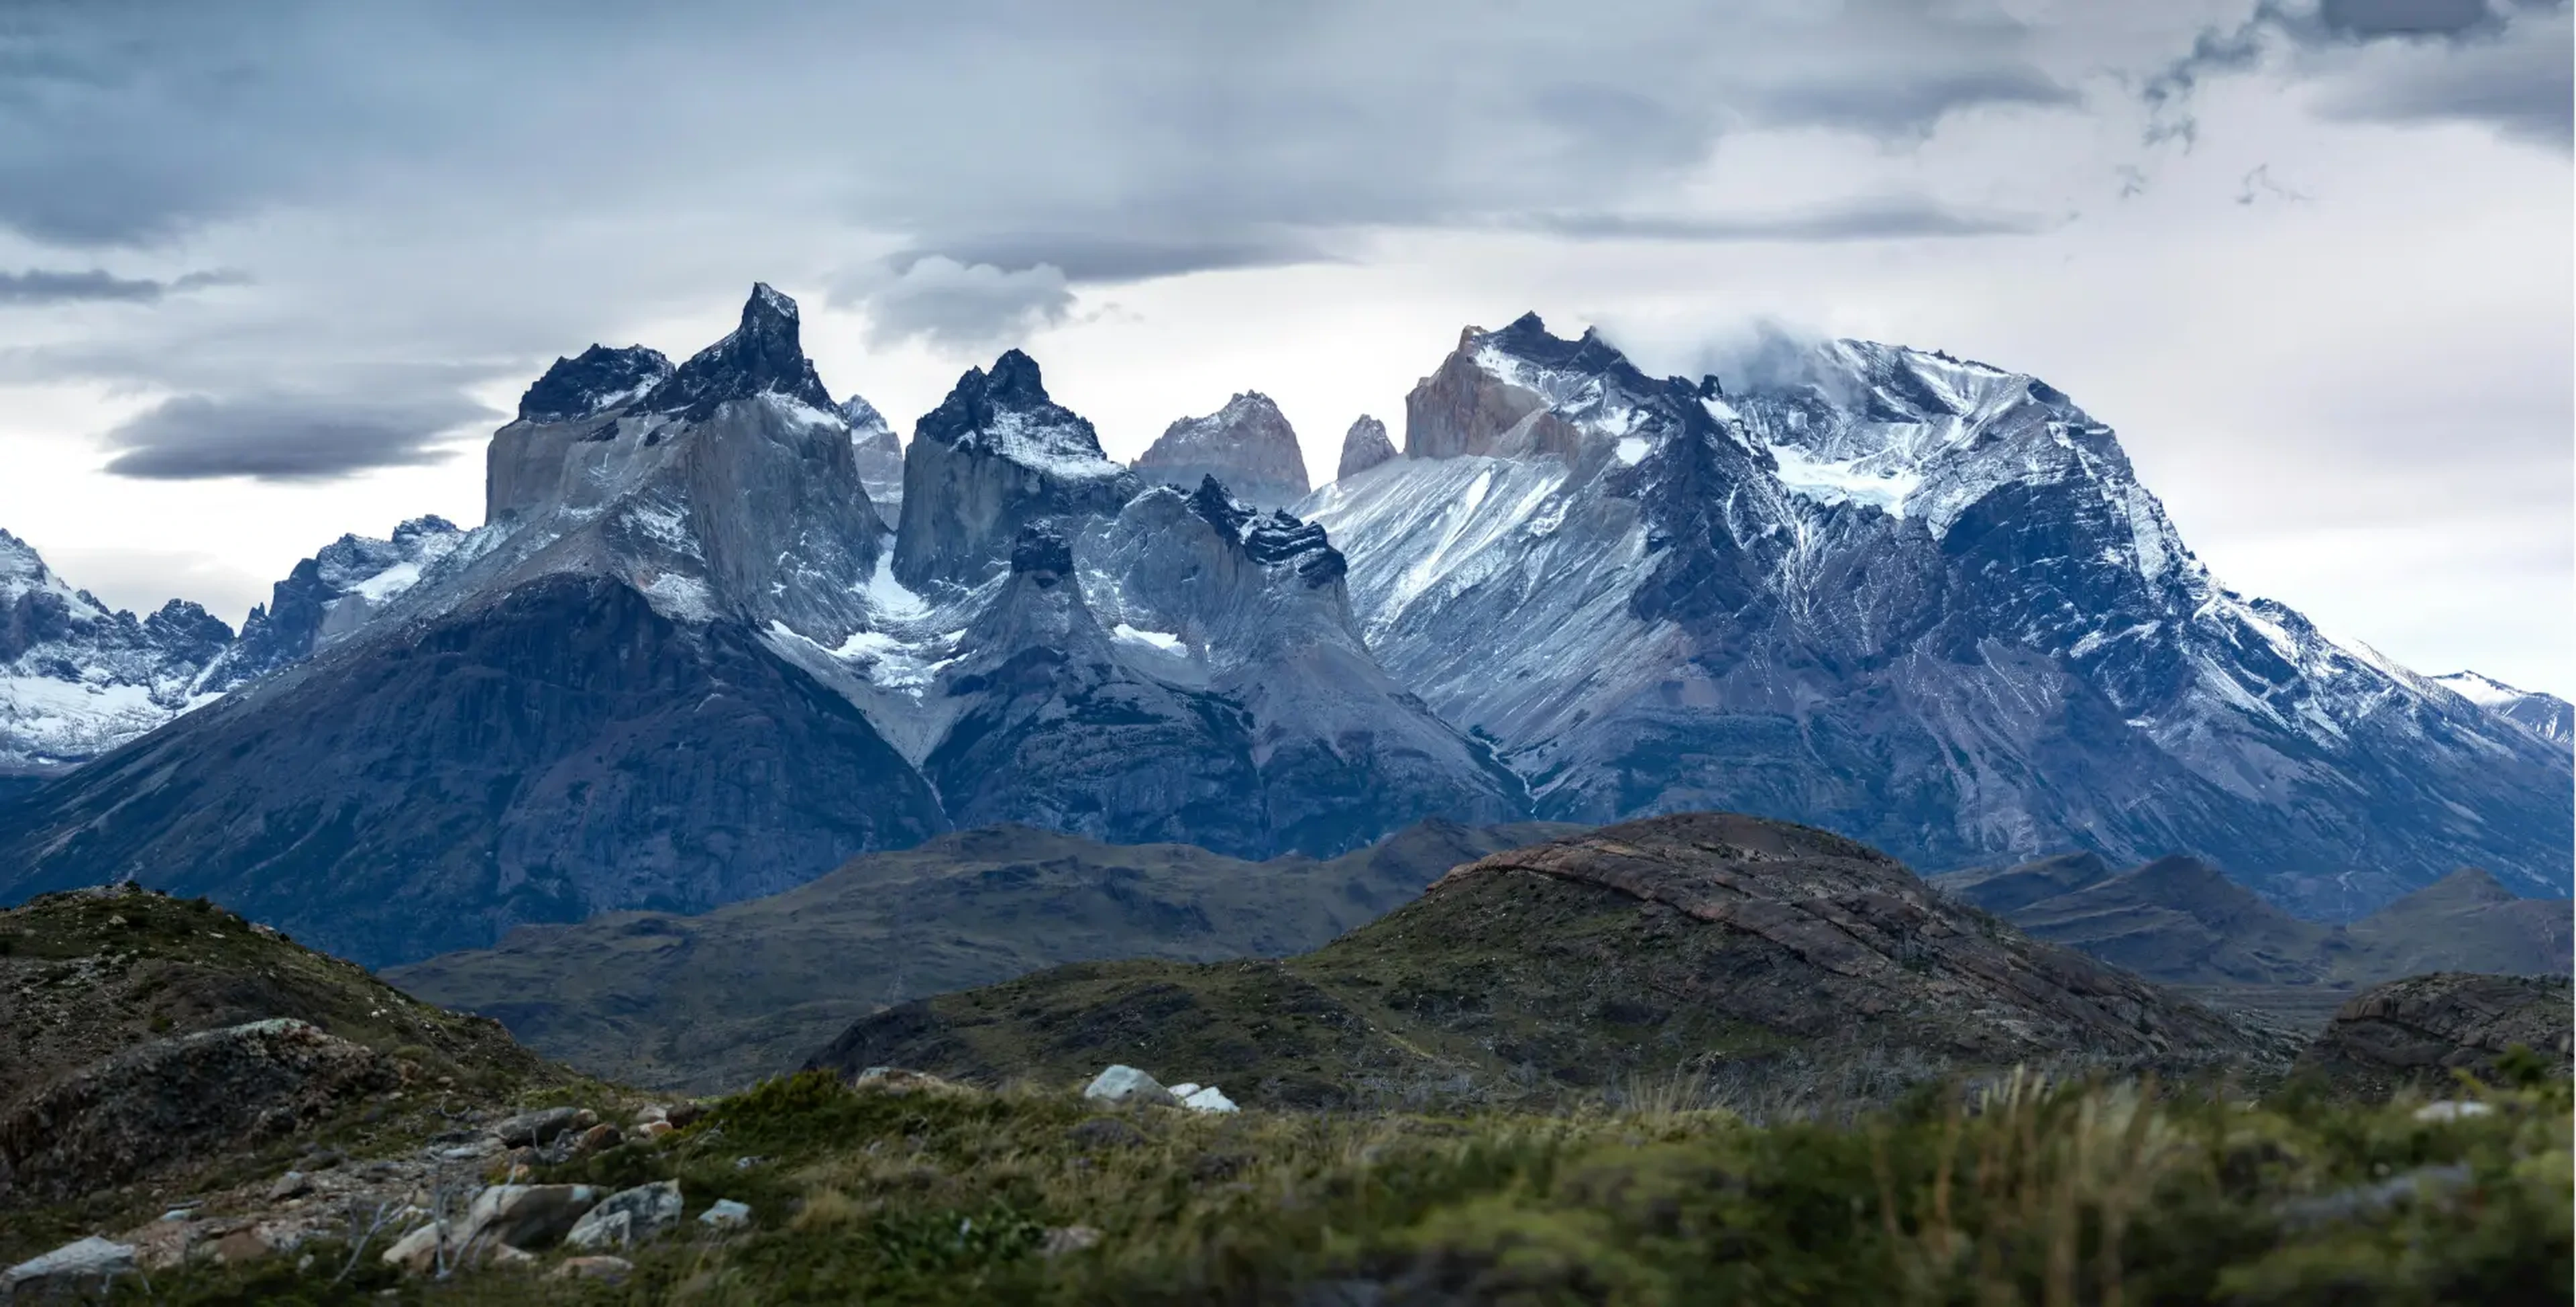
Granite towers of Torres del Paine rising under heavy Patagonian cloud

MINML Exploration

AI-native mineral exploration

We find the ground worth drilling.

Exploration is broken. The global supply chain is at risk.

The exploration record, 1979–2040

Cost per discovery ($M) Number of discoveries
Cost per discovery against number of discoveries, 1979 to 2040 Two series on one 0 to 250 range. Discoveries run from 88 in 1979 to a peak of 202 in 2009, then fall to 78 by 2025 and a projected 65 by 2040. Cost per discovery falls from $90M in 1979 to $53M in 2003, then climbs to a peak of $247M in 2015 and, after a dip, to a projected $250M by 2040. 0 50 100 150 200 250 1979 1981 1985 1990 1995 2000 2002 2003 2005 2007 2009 2010 2012 2015 2017 2019 2021 2023 2025 2030 2035 2040 Cost per discovery against number of discoveries, 1979 to 2040 Discoveries peak at 202 in 2009 and fall to 78 by 2025. Cost per discovery climbs from $53M in 2003 to $185M in 2025, and a projected $250M by 2040. 100200 1979200920252040
Economic discoveries and average cost per economic discovery, industry-wide. Dashed beyond 2025: projection.
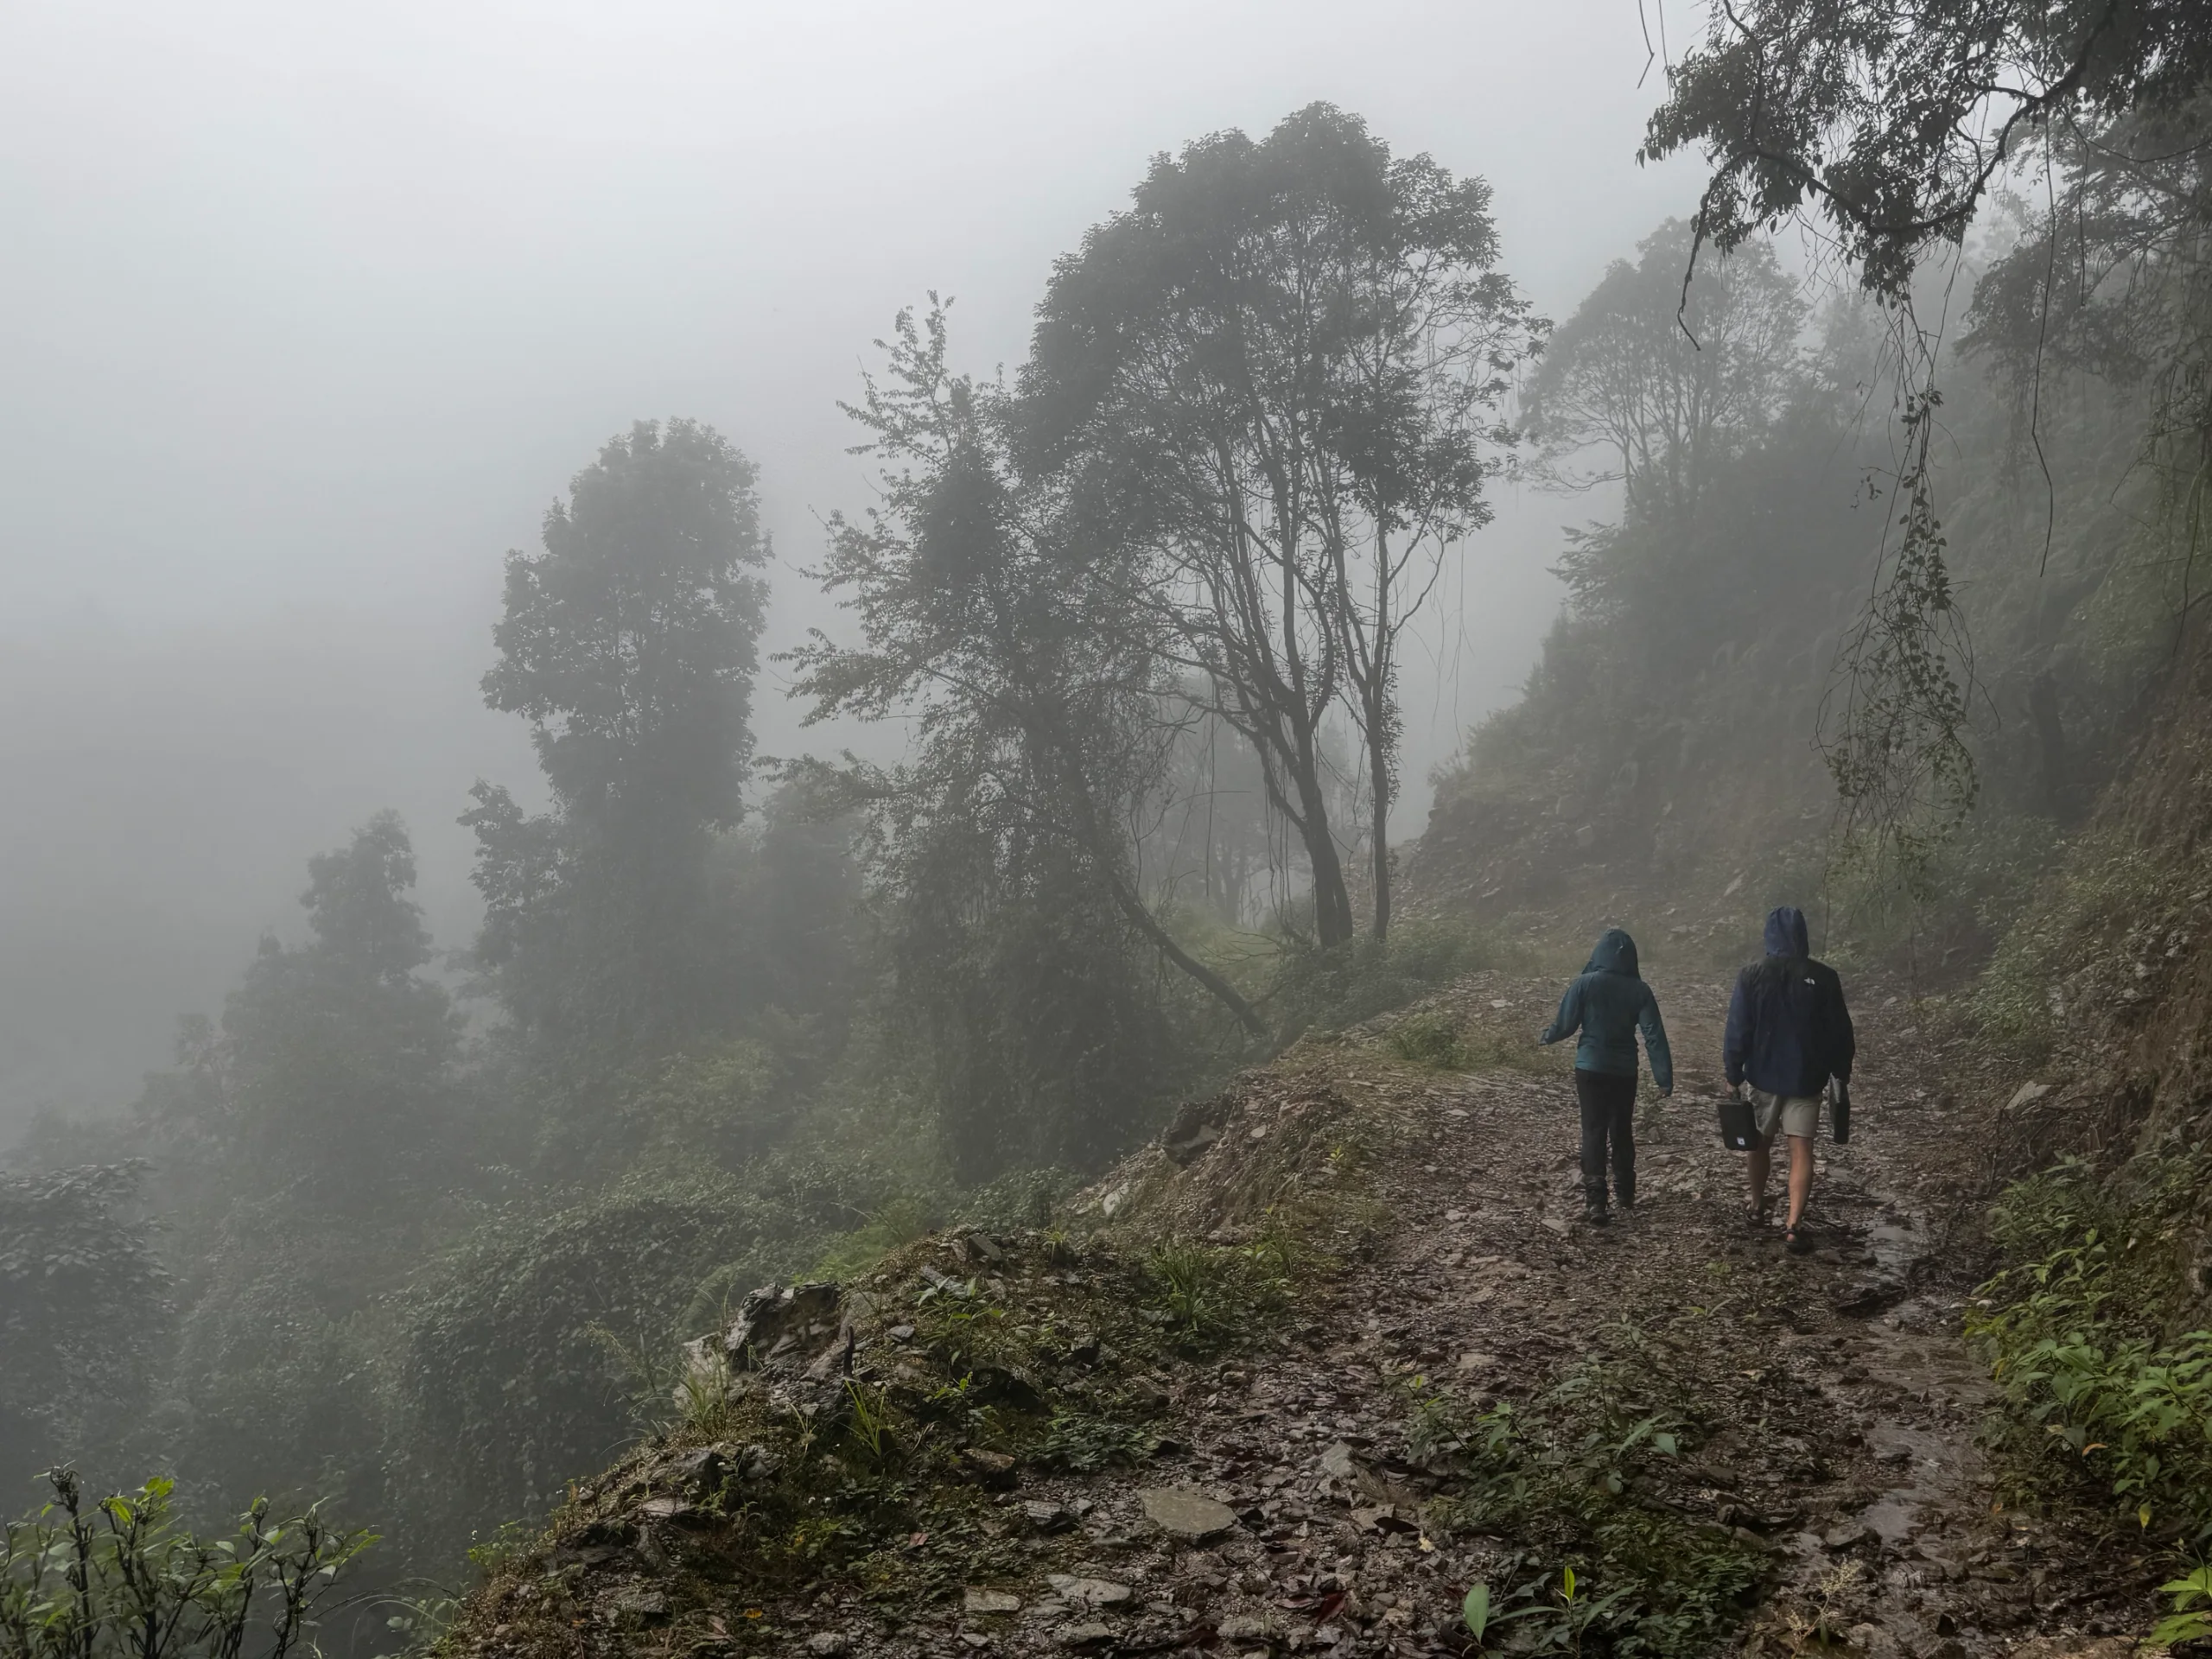
Two geologists walking a wet hillside track through heavy fog, one carrying a sample case

MINML exists to find the minerals the future depends on.

Our AI reads the ground.
Our geologists test it.
Our capital backs it.

How we work

Proven against the drill

Talon Resources · AIM: TAR

Eagle Lake, Canada

21.25m at 2.19 g/t

gold, including 8.75m at 5.05 g/t, at Cedar Trench: the highest-ranked target identified by MINML's PRISM platform.

RNS, 29 Oct 2026 · Preliminary
Mila Resources · LSE: MILA

Yarrol, Australia

70m to 170m

Drilling took gold mineralisation more than twice as deep, “consistent with the geological model being refined in collaboration with MinML.”

RNS, 12 Oct 2026

Blind test · Copper

Marimaca, Chile

84% in 5 holes

We ranked a planned ten-hole programme before it was drilled. The five we ranked highest held 84% of the mineralised metres.

MINML validation report

Backed by